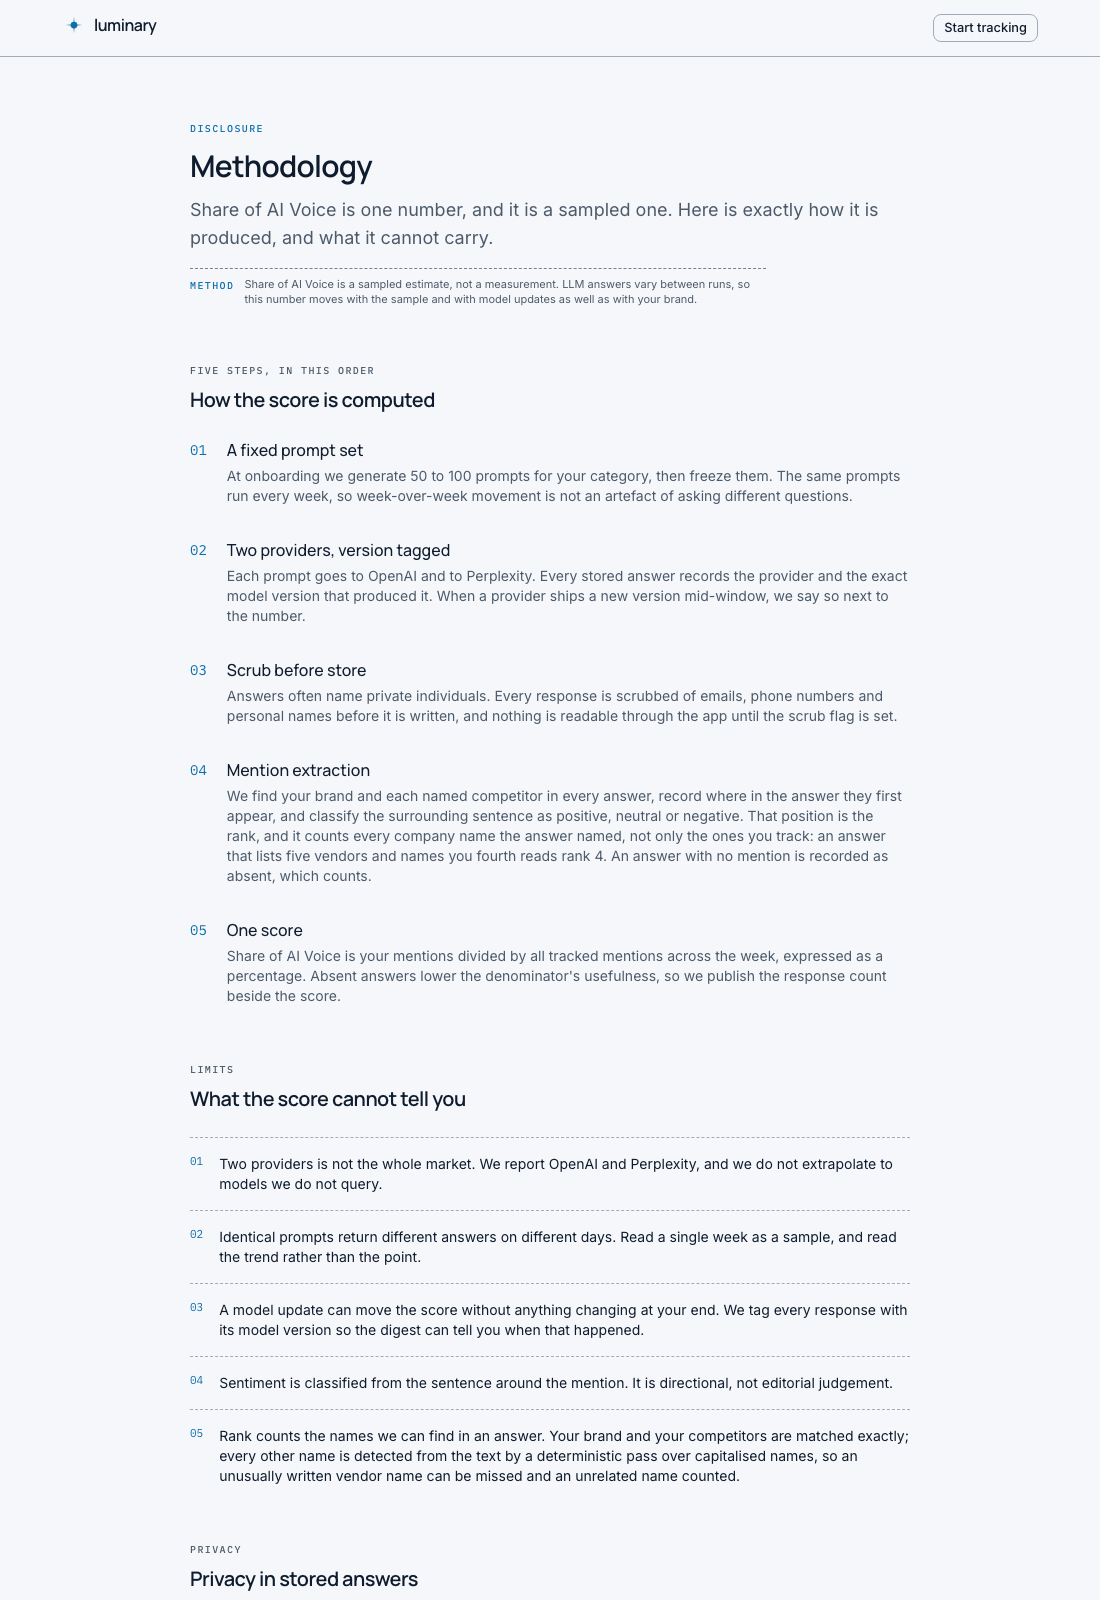
How Share of AI Voice is calculated, and what the number cannot tell you
Share of AI Voice is one ratio: mentions of your brand divided by mentions of your brand plus mentions of the competitors you named, counted across a fixed set of AI answers inside one week. This page works through that arithmetic, the four inputs that decide the result, and the questions the number is not able to answer.
Seenby is not open yet, so anything on this page about what it does is what it is being built to do.
The short answer
Share of AI Voice is a ratio, not a score out of ten. Take a fixed set of prompts, put them to AI answer engines, count how many times your brand is named, count how many times your named competitors are named, and divide.
Your mentions, divided by your mentions plus your named competitors' mentions, inside one week, on one frozen prompt set, on recorded model versions.
That is the whole calculation. Everything that makes the number defensible or useless sits in the four words doing the work: fixed, named, one week, recorded. Change the prompt set and the number moves. Change the competitor list and the number moves. Sample a different week and the number moves. Let a provider ship a new model inside your window and the number can move while nothing in the market has changed at all.
So the arithmetic is simple and the measurement is not. The rest of this guide is about that gap, because a brand manager carrying the figure into a board meeting has to be able to defend both halves: the sum, and the sampling that fed it.
Why a share needs a denominator you chose on purpose
Share of voice arrived in marketing from PR and social listening, where the denominator could plausibly be the whole conversation: all the press mentions, all the posts, all of it. AI answers do not work that way. There is no corpus of every answer ever generated, because each answer is produced on demand, once, for one person asking. You cannot measure the whole conversation. You can only measure the conversation you asked for.
That forces a choice, and the choice is the method. The honest version of the metric compares you against a named set of rivals, so the denominator is a market you defined and can explain in a sentence. Seenby takes your brand name, a description and up to three competitor names at setup, and those names are the denominator for every week that follows.
Two consequences matter more than the decimal places.
- A share with no competitors in it is not a measurement. If the denominator contains only your own mentions, the arithmetic returns one hundred percent every week, forever. Naming rivals is what turns a mention count into a share.
- The competitor set is an editorial call, not a fact. Name the three incumbents and your share looks modest. Name three smaller challengers and it looks strong. Neither list is wrong, but the resulting number is only comparable to itself, and only for as long as the list stays still.
We would rather you argued about the competitor list at setup than about the score in month four.
The four inputs that decide the number
The prompt set
The questions you sample are the sample. At onboarding, Seenby is built to generate 50 to 100 prompt templates in a single model call, from your brand name, your description and your competitor names. If that call fails or returns too few prompts, a curated fallback set takes its place. The set is then frozen. The same questions run every week, so the trend measures the market rather than your changing curiosity. Starter runs 50 prompts a week; Growth and Agency run 100.
The providers and their models
Different engines answer differently. So the provider mix is part of the definition, not a footnote to it. Seenby queries two providers, OpenAI and Perplexity. They sit behind a provider adapter interface that degrades gracefully if one provider is disabled. A share built on two engines is not the same measurement as a share built on five. Numbers quoted from different tools therefore tell you less than they appear to.
The competitor set
Up to three named competitors form the denominator. This is the input most people skip and the one that moves the headline figure most. Keep the list stable if you want the trend line to mean anything, and name the list out loud every time you report the score, in the same breath as the percentage.
The window
Seenby computes a single headline metric per brand per week. A week is long enough to absorb some of the run to run variation you get from models that are non-deterministic by default, and short enough that a real shift surfaces while you can still act on it. Compare a week to a week, never one afternoon's spot check to another.
How the number gets built, step by step
- Freeze the prompt set
At setup, your brand name, description and up to three competitor names produce 50 to 100 prompt templates. The set is frozen so that week over week movement comes from the answers, not from new questions sneaking into the sample.
- Run the set on a weekly cycle
The query engine is built to put every prompt to both providers once a week. If one provider is unavailable, the run is built to continue on the other. Seenby is on a waitlist rather than open, so read that as the designed cadence, not as a log of runs already delivered.
- Store each answer with its model version
Every stored response carries a tag for the model version that produced it. That tag is what later lets you separate a real competitive change from a provider shipping a new model. Emails, phone numbers, handles and personal names are redacted before an answer is stored, and the scrubbing step runs before any response is queryable.
- Extract the mentions
The parser reads each answer for your brand and for each named competitor, records the ranking position of each mention within that response, and classifies sentiment as positive, neutral, negative or absent. Absent is a real value, not a gap in the data: it records that the answer was read and you were not in it.
- Compute one share for the week
Mentions of your brand are divided by mentions of your brand plus mentions of your named competitors across the week's answers. The result is one headline metric per brand per week, rather than a per prompt league table you have to average in your head before anyone can use it.
- Attach the caveat to the record
Every computed score is stored with its methodology caveat text attached, and the disclosure is surfaced on every score display in the product as well as on a dedicated methodology page. The caveat travels with the number instead of living in a document nobody opens.
Three ways a tool can count a mention
| Counting choice | What it actually measures | Where it misleads |
|---|---|---|
| Presence: each answer counts once if the brand appears at all | How often you make the shortlist | Treats a passing aside and a lead recommendation as identical |
| Volume: every mention inside an answer is counted | How much of the text is about you | One verbose answer can carry a whole week's score |
| Rank weighted: earlier mentions count for more | Position on the shortlist, not only membership | Position inside a generated paragraph is softer evidence than it looks, and the weighting is invisible in the headline |
What the headline number keeps separate, and why
Seenby reports a single headline share per brand per week. Ranking position and sentiment are extracted and stored per response, and shown in their own views, rather than folded into the headline through a weighting scheme nobody outside the vendor can inspect.
That is a design choice with a reason behind it. A composite score that blends presence, rank and tone into one figure is easy to put on a slide and impossible to argue with, because you cannot tell which component moved. Keeping them apart means a flat share with worsening sentiment reads as what it is, which is a different problem from a falling share, and calls for a different response.
So the dashboard is built around four views that each answer one question. A 30-day trend line for Share of AI Voice, so you can see whether this week is a wobble or a direction. A sentiment breakdown, including the absent count. The top prompts where the brand is named and the top prompts where it is not. And a competitor benchmarking view against the names you chose.
When the number surprises you, the designed next move is the per prompt evidence, not a harder stare at the percentage. Growth and Agency include per-prompt evidence answer by answer and the full scrubbed answer log for as long as the account exists; Starter keeps 30 days of answer log history. The point of the log is that absence has an address: a specific question, on a specific engine, in a specific week.
Real change, or the model changed
This is the objection most often raised against the whole category, usually phrased as "the results change every time I ask", and it deserves a straight answer rather than a reassurance.
The objection is partly correct. OpenAI's own API documentation states that chat completions are non-deterministic by default, meaning outputs may differ from request to request, and it exposes a system fingerprint field precisely so that developers can tell variation caused by their own settings from variation caused by changes the provider has made on its side. Providers also retire and replace dated model snapshots on a published schedule, with notice periods and recommended replacements. The ground under any AI visibility measurement moves, and no vendor controls that.
So a measurement method here has two jobs: reduce the noise it can reduce, and label the noise it cannot. A frozen prompt set and a weekly window handle the first. Model-version tagging on every stored response handles the second, and the weekly digest is built to carry drift alerts tied to model-version changes when applicable, alongside the methodology caveat.
The caveat is worth stating in full, because it belongs in your reporting as much as in ours: a week over week move in Share of AI Voice may reflect a model update rather than a real change in how the market sees you. When a model version changed inside the window, treat the move as unexplained until the per prompt evidence says otherwise. A number you can question is worth more than a number you cannot.
What the number cannot tell you
Five limits, stated plainly, so you are not surprised by them in a meeting.
It is not a measure of traffic or demand
Share of AI Voice counts how often you are named in a sample of AI answers. It says nothing about how many people asked, what they did next, or what any of it was worth. We make no claim that the score predicts clicks, pipeline or revenue, and you should not present it as if it did.
It is not the whole of AI search
The measurement covers the engines it queries, OpenAI and Perplexity, on your frozen prompt set, in one week. Report it that way. A score with its scope attached survives questions; a score presented as "our AI visibility" invites one you cannot answer.
It is not anyone else's session
Every answer is generated on demand, and identical requests can return different text. The sample tells you what the engines tended to say to the questions you chose, in that window. It is not a transcript of what your buyer saw on Tuesday.
It does not explain itself
The share tells you the proportion. It does not tell you why. Causation lives in the per prompt evidence, the sentiment breakdown and your own knowledge of what you published and when, and even then you are reasoning, not proving.
Rank and sentiment are classifications, not verdicts
Ranking position is recorded for each mention inside a response, and sentiment is classified into positive, neutral, negative or absent. Both are useful signals and neither is a human reading of the answer. Where the stakes are high, read the answer.
How to report the number so it survives a sceptical question
A brand manager's real problem is not computing the score, it is defending it to a CMO or a board that has every right to be sceptical of a metric invented eighteen months ago. Five habits make that defence short.
- State the denominator first. "Against these three named competitors" is a six word phrase that prevents most of the argument.
- Quote the sample with the score. The prompt count, the two providers and the week. A percentage with no sample behind it is a decoration.
- Compare like windows only. Week against week, from the same frozen prompt set. The moment the prompt set changes, the series starts again, and you should say so.
- Carry the caveat, every time. If a model version changed in the window, say that before anyone asks. Seenby attaches the methodology caveat to every computed score and surfaces the disclosure on every score display for exactly this reason.
- Pair the share with the absences. The prompts where you were not named are the actionable half of the report. The share is the summary; the absent list is the work.
Where to read the next piece
This guide is the arithmetic and its limits. Three sibling pages go deeper on the parts that do the heavy lifting.
- Share of AI Voice, defined is the shorter definition, for when you need to explain the metric to someone else in a paragraph rather than a page.
- Methodology on every score, not in a footnote covers where the caveat appears in the product and why it is attached to the record rather than published once.
- Model-version tagging goes through how a model update is distinguished from a real competitive move, which is the mechanism behind the drift section above.
- The LLM answer log covers the evidence layer: the stored, scrubbed answers behind each count, and what you can read in them.
Questions
What is a good AI share of voice score?
There is no published benchmark we would stand behind, and any single number offered as one would depend entirely on the competitor list it was computed against. The useful comparison is your own series: the same frozen prompt set, the same named competitors, week against week. A share of 20 percent against three incumbents can be a stronger position than 60 percent against three smaller challengers.
Why did my share move when nothing changed in the market?
Two reasons, both ordinary. AI answers are non-deterministic by default, so repeated requests can return different text, and providers retire and replace dated model versions on a published schedule. That is why every stored response is tagged with its model version, and why the weekly digest is built to raise a drift alert tied to model-version changes when applicable. A week over week move may reflect a model update rather than a real competitive change.
Which engines are queried for the score?
OpenAI and Perplexity, on every plan, through a provider adapter interface that degrades gracefully if one provider is disabled. The score should always be reported with the engines it was computed from, because a two engine share and a five engine share are not the same measurement.
How many prompts does the calculation need?
Seenby is built to generate 50 to 100 prompt templates at setup from your brand name, description and competitor names, with a curated fallback set if generation fails or returns too few. Starter runs 50 prompts a week, Growth and Agency run 100 per brand. The set is frozen afterwards so the trend measures the answers rather than changing questions.
Can I track more than three competitors?
The denominator is up to three named competitors per brand. Agency covers up to five brands in one account, each with its own frozen prompt set and up to three named competitors of its own.
Does the score count mentions, or position in the answer?
The headline share is built from mentions: your brand's mentions over your brand's plus your named competitors'. Ranking position within each response and sentiment are extracted and stored per answer and shown in their own views, rather than blended into the headline through a weighting scheme you cannot inspect.
How do I see the answers the score was built from?
Per-prompt evidence, answer by answer, and the full scrubbed answer log kept while the account exists are included on Growth and Agency; Starter keeps 30 days of answer log history. Emails, phone numbers, handles and personal names are redacted before any answer is stored.
Is the score computed daily?
Weekly. One headline metric per brand per week, from the same frozen prompt set, with a 30-day trend line on the dashboard. A week is long enough to absorb some run to run variation and short enough to act on.
Sources
Related
- Methodology on every score, not in a footnote
How Seenby computes Share of AI Voice, and why the methodology caveat is stored on every weekly record and surfaced wherever the score appears.
- Model-version tagging: telling real drift from a model update
Seenby tags every stored AI answer with the model version that produced it, so a move in your Share of AI Voice can be read as a market change or as a model update, not guessed at.
- The LLM answer log, scrubbed and tagged with its model version
When the weekly score moves, the answer log is the evidence underneath it: Seenby is built to store every reply OpenAI and Perplexity give your tracked prompts, redacted before it is queryable and tagged with the model version that produced it.