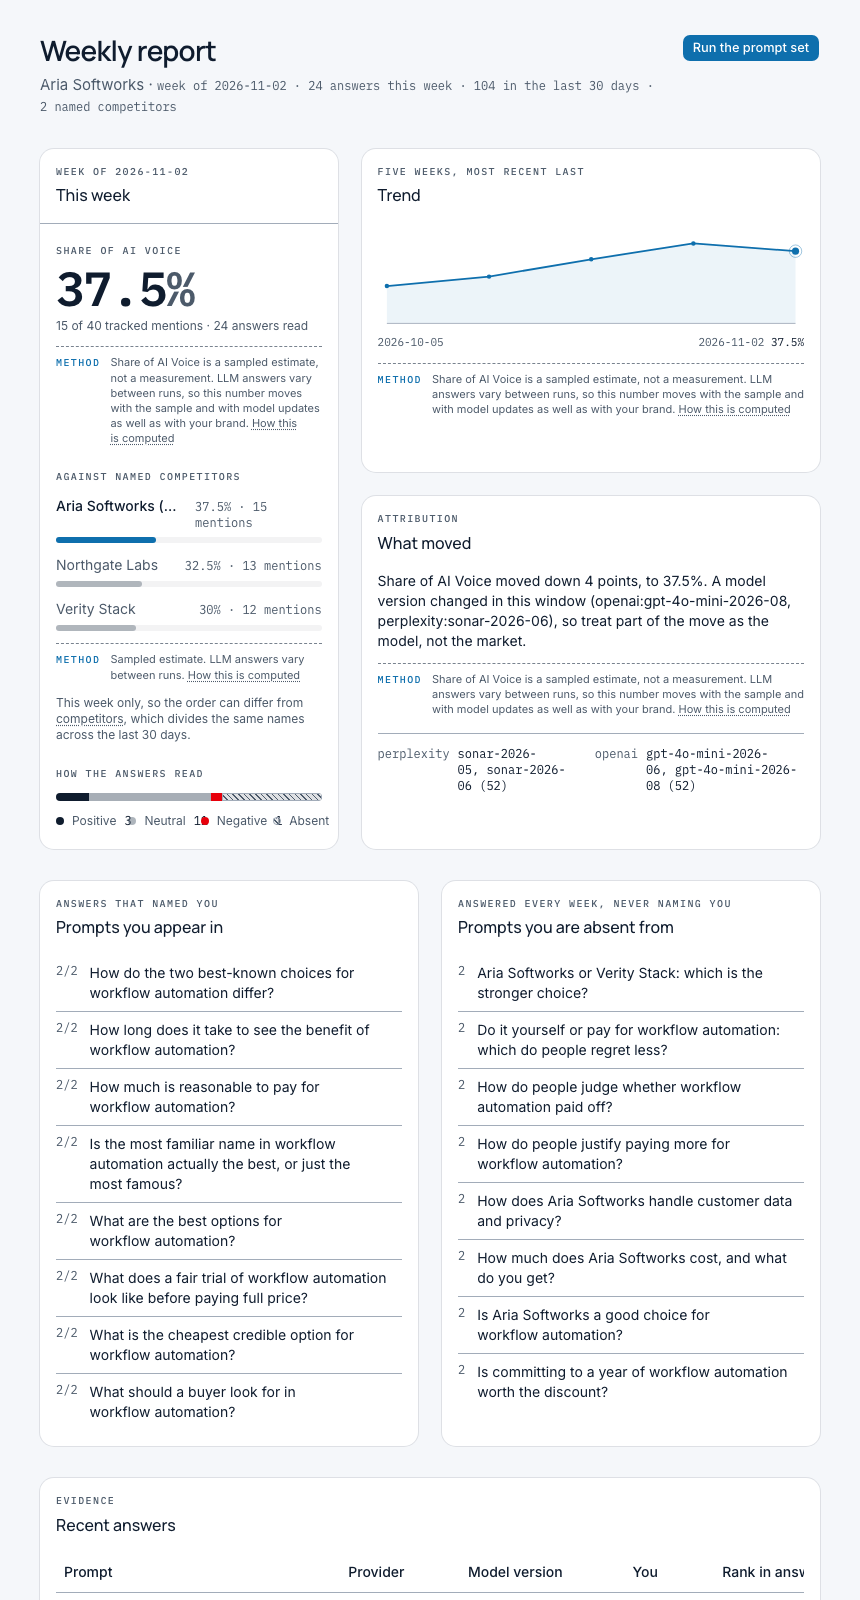
How to measure AI visibility: a working method for mid-market teams
Measuring AI visibility means running a fixed set of buyer questions through AI assistants on a schedule, then counting how often you are named, how you are described, and where you stand against the competitors you chose to be measured against.
Seenby is not open yet, so anything on this page about what it does is what it is being built to do.
What measuring AI visibility actually means
You cannot query an AI assistant for your position the way you query a rank tracker for a keyword. An assistant returns prose. Sometimes it names four vendors, sometimes one, sometimes none, and the wording differs between two identical asks. So measurement here is not retrieval, it is sampling: you fix a set of questions, you ask them repeatedly on a schedule, you read the answers with a parser instead of your eyes, and you turn thousands of sentences into a small number of figures you can put in a report.
Four decisions decide whether that figure is worth anything: which prompts you ask, which engines you ask them of, how often you ask, and whom you compare yourself to. Get any of the four wrong and you will produce a number that moves without an explanation, which is worse than no number, because someone will act on it. The rest of this page is those four decisions in order, followed by the test that matters most once the data starts arriving, which is whether a move came from the market or from a model.
One thing belongs at the top rather than in a footnote. LLM answers are non-deterministic and they change when a provider ships a model update. A week over week move in any AI visibility metric may reflect a model update rather than a real change in how the market sees you. Every credible version of this measurement carries that caveat next to the number, not three pages away from it.
Why your existing numbers do not transfer
Analytics can tell you a session arrived. It cannot tell you the answer that preceded it, whether you were named, whether you were named first, or whether the assistant described you as the enterprise option when you sell to mid-market. Impressions and clicks describe a results page. AI visibility describes a paragraph. They are different objects and they need different instruments, which is why the work below starts with writing questions rather than with pulling a report.
Four metrics worth keeping separate
Presence rate
The share of sampled answers that name you at all. Track it per prompt as well as in aggregate, because a high aggregate can hide total absence from the five prompts that matter commercially.
Share of AI voice
Your mentions as a proportion of mentions of you plus a named competitor set, across the same answers. It only means something if the denominator is defined and stated. The tracker page in this pillar covers how one weekly score is computed and reported.
Sentiment of the mention
Whether each mention is positive, neutral or negative, so a presence problem can be told apart from a positioning problem. The sentiment page covers classification and its failure modes.
Position within the answer
Where you sit in a list of recommendations. First named and fifth named are not the same outcome, and rank tends to move before presence does. The same sentiment and ranking page goes into how it is recorded.
The method, step by step
- 1. Write down the questions your buyers actually ask
Start from demand, not from your product taxonomy. Pull the phrasing from sales calls, support tickets, your site search and the queries that already convert. You are looking for the questions where being recommended has commercial consequences, not the questions where you happen to win.
- 2. Expand them into a prompt set of fifty to a hundred
One prompt is an anecdote. Fifty to a hundred is a sample you can compute on. Cover category questions, alternative and comparison questions, use case questions, objection questions, and a few branded ones. Below roughly fifty prompts, a single answer swinging changes your headline figure visibly.
- 3. Name your competitor set before you compute a share
One rule matters here: never compute a share figure with an empty competitor set, because your own mentions then divide by themselves and you get a permanent hundred percent that means nothing. The benchmarking page covers how to choose the rivals and read the comparison.
- 4. Choose the engines you will sample and how failure is handled
Decide which assistants you cover, and decide in advance what happens when one of them is unavailable or withdraws access. Provider policies and rate limits are real constraints on this category. A measurement design that collapses when one engine goes dark is not a measurement design.
- 5. Freeze the prompt set and set a cadence
Run the same prompts on the same rhythm. If the questions change between runs, the trend measures your editing, not the market. Weekly is the usual compromise: frequent enough to catch a move, spaced enough that provider costs and noise stay manageable.
- 6. Parse every answer and store the evidence
Extract mentions of you and each competitor, classify sentiment, record position, and keep the answer text itself alongside the tally. The raw answer is what lets you defend or discard the number later. Tag every stored answer with the model version that produced it.
- 7. Compute one headline number, with its caveat attached
Roll the week up into a single figure per brand, and attach the methodology statement to the figure itself so it travels into every screen, export and slide. Then read the trend rather than the point. Four weeks of direction tells you more than any single week's value.
Choosing the prompts, the decision that determines everything else
Most disappointing AI visibility programmes fail here, and they fail in the same two ways.
The first is vanity prompts. If your set is dominated by questions that contain your brand name, you will measure a high presence rate and learn nothing, because an assistant asked about you will talk about you. Branded prompts are worth a handful of slots to check the accuracy of your description. They should not drive the headline.
The second is prompts nobody asks. Generated prompt sets drift toward tidy category phrasing that no buyer types. Read the set before you freeze it. If a line does not sound like something a person in a deal would say out loud, cut it or rewrite it. The test is simple: could you imagine this sentence arriving in your inbox from a prospect who had not spoken to you yet.
A useful shape for a set of fifty to a hundred prompts:
- Category discovery, the plain "best tool for X" and "how do I solve Y" questions, the largest group.
- Comparison and alternatives, which is where competitor sets surface most reliably.
- Constrained buying questions that carry a segment, a size, a budget or an industry, since these are where mid-market brands get sorted into or out of the shortlist.
- Objection questions, the risk, price, migration and integration asks.
- A small branded block to check how you are characterised rather than whether you appear.
Two disciplines apply throughout. Write the prompt set once, then leave it alone for at least a quarter, because every edit resets the comparability of the trend. And keep a note of the date you froze it and the date of any change, because the first question an analyst will ask about a step change in your chart is whether you changed the questions. If you cannot answer that from a record, you cannot defend the chart.
It is also worth deciding, at this stage, which prompts you intend to win. A frozen set is not just an instrument, it is a shortlist for the content team. Marking five or six prompts as commercially decisive turns a monitoring habit into a brief, and it gives you something to review against in a month.
Which engines to sample, and what to do about the ones you cannot reach
Coverage is a trade-off, not a checklist. Each additional engine multiplies query volume, cost and the number of different failure modes you have to handle. Each engine you leave out narrows what your number describes.
Sample where your buyers actually ask, and be honest in your reporting about the boundary. A number computed from two engines is a number about two engines. That is a legitimate measurement as long as the label says so. A number that claims to cover every assistant but quietly samples one is not.
Two practical constraints shape this decision more than most teams expect. First, access is granted, not owned: providers set usage policies and rate limits for automated querying, and continuous commercial monitoring sits squarely in the territory those policies govern. Build the system behind an adapter layer so a single engine can be switched off without taking the measurement with it. Second, answers with citations and answers without them are different evidence. Some assistants show the sources they drew on, which tells you which pages earned the mention. Others give you prose only, which tells you the outcome but not the route. Do not average those two things together and call the result one insight.
Cadence, sample size and the cost of asking
Non-determinism is handled with volume and repetition, not with cleverness. A single ask of a single prompt is noise. The same prompt asked every week for eight weeks, alongside fifty-nine others, produces a distribution you can reason about.
Daily sampling multiplies provider cost without changing what you can act on, because the work that moves AI visibility, publishing, positioning, earning citations and third-party coverage, does not land daily. Monthly sampling is too slow to connect a move to a cause, and it also means a single bad sampling day can define the month. Weekly is where most mid-market teams land, and it maps onto the reporting rhythm they already have.
Whatever cadence you choose, hold three things constant: the prompt set, the competitor set, and the time of week you run. Then record what you could not hold constant. Model versions change underneath you. Providers go down. A batch fails halfway. If you do not log these, you will eventually explain a model update as a competitor campaign in front of your leadership team, and nobody in the room will be able to tell you that you are wrong.
One more rule that sounds pedantic and saves you twice a year: an unsampled week is not a zero. If a run did not complete, report no score, not zero percent. A zero in a trend line is a claim that nobody named you, which is a very different statement from "we did not look".
What each way of measuring can and cannot tell you
| Approach | What it can tell you | What it cannot |
|---|---|---|
| Asking an assistant yourself in the browser | Whether you appear for one question today, in the exact words an executive used when they asked you | Anything about trend, share, or whether the result would repeat five minutes later |
| A monthly spreadsheet of manual spot checks | A rough directional read on a handful of priority prompts, at no software cost | Volume large enough to survive non-determinism, a defensible denominator, or a record of the model version that answered |
| Keyword rank tracking and traditional SEO reporting | How your pages perform in a results page, which still matters as an input to being cited | How an assistant describes you, who it named instead, or where you sat inside the answer |
| Continuous sampling of a frozen prompt set | Presence, share against a named competitor set, sentiment, rank, and a trend you can attribute | Certainty. It reports a sample of a non-deterministic system, so it needs its caveat and its raw answers kept alongside it |
The objection to take seriously: the answers change every time
This is the strongest argument against buying or building anything in this category, and it deserves a straight answer rather than a rebuttal.
It is true. Ask the same question twice and the wording, the order and sometimes the list of brands will differ. Ask it after a provider updates a model and the difference can be larger still. No tool, including ours, can make an LLM deterministic or promise that a given answer will repeat.
What a measurement can do is stop pretending each answer is a fact and start treating it as an observation. Three things make the aggregate usable:
- Volume. Fifty to a hundred prompts per run means no single answer sets the number. Individual variance averages out; a real shift in how you are represented does not.
- A constant instrument. The same prompts, the same competitor set, the same cadence. When only the answers change, the change is about the answers.
- Recorded conditions. Model version stored on every answer, so a discontinuity that coincides with a provider update can be identified as exactly that.
What you get from this is a directional, caveated market signal, not a precise instrument. Report it that way. A team that says "our share of AI voice moved from the high twenties to the mid thirties across sixty prompts on two engines, and no model version changed in that window" is making a defensible claim. A team that reports 34.2 percent with a decimal point and no methodology is making an indefensible one.
Telling a real move from a model update
Once you have four or five weeks of data, most of your analysis time goes on one question: did the market change, or did the model? This is the part of the method that no dashboard can do for you, and it is where the difference between a habit and a reporting line gets decided.
Work through it in order.
First, check the model version recorded against the answers in the current run versus the previous one. If the version changed, treat the step as suspect until proven otherwise, and expect the level to have reset rather than trended. A reset level is not a failure of the measurement, it is a new baseline, and it should be annotated as one.
Second, check whether the move is broad or narrow. A real competitive shift usually concentrates: a competitor starts appearing in the comparison prompts, or you drop out of one use case cluster. A model-driven shift tends to move everything at once, including prompts where nothing about your market has changed. Sort your prompts by how much each one moved before you look at the total.
Third, read the answers. This is the step teams skip and the only one that produces a cause. Pull the prompts where you were named last week and not this week, and read what the assistant said instead. You are looking for the new source it leaned on, the framing it adopted, the competitor it substituted. Two dozen answers read properly will beat another metric every time.
Fourth, check your own denominator. If a competitor rebranded, merged or is now referred to by a different name, your mention extraction may be missing them, which inflates your share without anything real having happened. The same goes for your own brand if it has a common word in it.
Only after those four checks is it reasonable to attribute the move to your own work, or to someone else's. And when you do attribute it, write down the attribution and the date, because next quarter you will want to know which of your explanations held up. That record, more than any single figure, is what turns AI visibility measurement into something a leadership team can rely on.
Where to go deeper
The measurement is half the job and the reporting is the other half. The sibling pages in this pillar carry the parts this overview deliberately leaves alone: the tracker page covers the single weekly score and the caveat that travels with it, the benchmarking page covers the named competitor view answer by answer, the sentiment page covers classification and rank inside each answer, the weekly report page covers the digest and its drift alerts, the SEO reporting page covers fitting all of this into a monthly report an analyst cannot dismantle, and the brand manager page answers the question that usually starts this search, which is how ChatGPT describes you when nobody from your company is in the room.
Where this measurement usually goes wrong
No named competitor set
A share metric with an empty denominator returns a hundred percent forever. If you will not name rivals, report presence rate and sentiment instead, and say plainly that you are not reporting share.
A prompt set that keeps changing
Every edit breaks comparability with the weeks before it. Freeze the set, date the freeze, and annotate the chart whenever you revise it so nobody reads an editing decision as a market move.
Zeros standing in for missing data
A failed or partial run should produce no score, not zero percent. Reporting an unsampled week as a zero creates a cliff in the trend line that will cost you an hour of explanation and some credibility.
Trusting a sentiment label without reading the answer
Use sentiment to decide which answers to read, then let the reading, not the label, decide what you report.
Reporting the number without its caveat
A figure quoted in a deck without its methodology invites every stakeholder to treat it as exact. Keep the caveat attached to the number itself so it survives being copied into a slide.
Measuring without a next action
A presence rate that nobody uses to commission content, fix a positioning line or chase a citation is a cost. Tie each run to a short list of prompts you intend to win, and review that list monthly.
Questions
How is AI share of voice calculated?
Count mentions of your brand across the answers sampled in a period, then divide by the total mentions of your brand plus the competitors you named, over the same answers. The denominator is the whole design decision: the metric only means something if the competitor set is deliberate and stated. With no competitors named, the figure is always a hundred percent and tells you nothing.
What is a good AI share of voice score?
There is no universal benchmark, and any single figure quoted as one should be treated with suspicion, because the value depends entirely on how many competitors sit in your denominator and which prompts you chose. Judge yourself on two things instead: your direction over four or more weeks on an unchanged prompt set, and your standing relative to the specific rivals you named.
How often should I measure AI visibility?
Weekly suits most mid-market teams. It is frequent enough to connect a move to something you did, slow enough to keep provider query costs and random variance manageable, and it fits the reporting rhythm most marketing teams already run. Daily sampling multiplies cost without changing what you can act on.
Can I measure AI visibility manually for free?
Yes, for a first read. Write ten prompts your buyers actually ask, run them in the assistants you care about, and log whether you were named, who else was, and in what order. What manual checking cannot give you is enough volume to survive non-determinism, a consistent weekly baseline, or a record of which model version produced each answer, which is what you need before anyone reports the number upward.
Which AI engines should I track?
Sample where your buyers ask, and label your number with the engines it covers rather than implying total coverage. Seenby is built to hit exactly two providers, OpenAI and Perplexity, behind an adapter interface that degrades gracefully if one is disabled, so the measurement continues on the remaining provider rather than stopping.
Does a score change when a provider updates its model?
It can, and this is the caveat that has to travel with the metric. A week over week shift may reflect a model update rather than a real competitive change. The defence is to tag every stored answer with the model version that produced it, so a step change that coincides with an update can be identified as model drift rather than market movement, and to keep the methodology disclosure attached to every score display.
Do I have to name competitors to use this method?
To report share, yes. Pick two or three rivals you are genuinely compared to in deals, because that set defines the denominator. Seenby is built to take up to three named competitors at onboarding and benchmark against them in the dashboard. Without them, stay with presence rate and sentiment and say so in the report.
What will AI visibility tracking cost with Seenby?
It includes Share of AI Voice with a 30-day trend, sentiment and per-prompt evidence, competitor benchmarking answer by answer, the full answer log scrubbed and tagged with its model version, and the weekly digest with drift alerts. Seenby is pre-launch, so nothing is on sale yet; the price is published so you can plan, and the waitlist is what you can join today.
Related
- AI brand sentiment tracking: sentiment and rank inside every answer
Seenby is built to read every AI answer your prompt set returns and record three things: whether your brand was named, how the language around the mention read, and where you sat in the order the model gave.
- AI search prompt tracking, from a set of 50 to 100 prompts
Seenby builds an AI search prompt set for you at setup, 50 to 100 prompts generated from your brand description and up to three named competitors, then keeps that set still so movement in the answers is movement in the market.
- AI visibility for B2B SaaS brands
Seenby is built for B2B SaaS teams who need to know whether ChatGPT and Perplexity name them when a buyer asks an unbranded category question, and where they sit against three named rivals.
- An AI visibility tracker built around one weekly score
Seenby is an AI visibility tracker that reads what OpenAI and Perplexity say about your brand, extracts every mention, sentiment and rank, and computes one Share of AI Voice score a week with its methodology caveat attached.
- Benchmark your AI share of voice against three named competitors
Seenby benchmarks your Share of AI Voice against up to three competitors you name, answer by answer, across one repeating weekly prompt set on OpenAI and Perplexity.