How to report AI search performance to executives without overclaiming
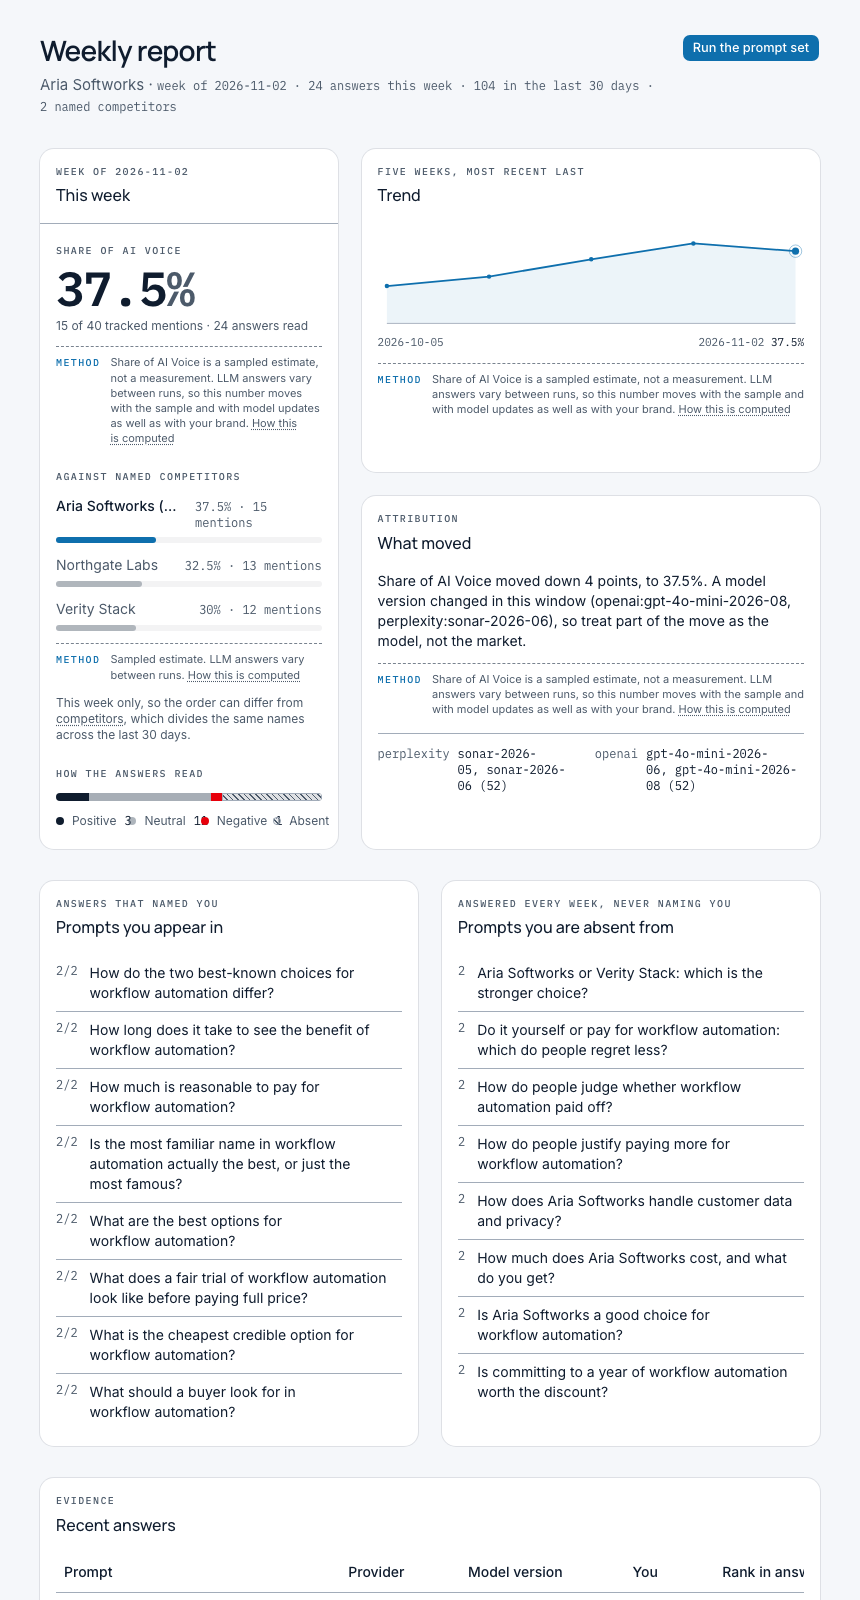
Report AI search performance as one headline number per period, with the sample it came from, the caveat that qualifies it, and the named competitors it is measured against. Everything else on the slide is evidence and the decision you want, because a number presented with more confidence than the data supports will not survive its first challenge in the room.
Seenby is not open yet, so anything on this page about what it does is what it is being built to do.
The short answer
Report AI search as one headline number per period. Beside it, put the size and shape of the sample it came from, the competitor set it is measured against, and the caveat that week over week movement can reflect a model update rather than a real change in the market. Then spend the rest of the page on two or three verbatim answers and the single decision you want from the room.
Executive reporting on AI search usually fails for one reason. The number is presented with the confidence of a rank tracker, and the first sharp question takes the whole report down with it. Someone opens ChatGPT on their phone, asks the same question you sampled, gets a different answer, and says so out loud. If your slide claimed a rank, you have nothing to say. If your slide claimed a sampled share with its method stated, you have already answered them.
So the job is two things at once. Say something definite, because a report that hedges every sentence reads as no signal at all. And be specific in advance about what the measurement cannot prove, so the caveat arrives from you rather than from the most sceptical person at the table.
What the executive is actually asking
The question that starts most of these projects is not a metric request. It is a version of "how does ChatGPT describe us?", often prompted by a competitor showing up in an answer where the brand did not. That matters, because it tells you what the report has to resolve.
Underneath it there are three decisions an executive is trying to make:
- Are we present, or are we absent? Absence is the finding that changes budgets. Presence at a middling level rarely does.
- Is a rival being named instead of us, and by name which one? Share language only means something against a named set. Without rivals in the denominator you are reporting a count, not a share.
- Is this getting better or worse, and did we cause it? This is where overclaiming happens, because causation in AI answers is weak and the temptation to take credit is strong.
Write the report to those three, in that order. Anything that does not serve one of them is decoration.
The one thing not to promise
Answer engines do not hand you a clickstream. You cannot trace a sentence in an AI answer to a pipeline number with presence data, and if you imply you can, you will be asked to prove it next quarter. Report presence, sentiment and position. Let the demand-generation report own revenue.
Why your existing reporting habits do not transfer
Ten years of search reporting trained everyone in the room to expect a rank, a volume and a click. AI search gives you none of those cleanly, and the report has to be built around the differences rather than papering over them.
There is no single result page. There is a set of questions, an answer to each, and your brand's position within each answer. The unit of measurement is the prompt set, not the keyword.
The output is non-deterministic. Ask the same question twice and the wording, the order and sometimes the brands named will differ. This is the standard objection to buying anything in this category, and it is a fair one. The answer is not to pretend the variance is absent. It is to sample enough prompts, on a fixed set, and report the level rather than the decimal.
The measuring instrument changes underneath you. Providers ship model updates without asking. A score that moves the week a model version changes may be telling you about the model, not about your market. Tagging every stored answer with the model version behind it is what lets you tell those two apart, and saying which happened is the difference between a credible report and a guess.
Coverage is partial by definition. No tool reads every answer engine, and any that implies otherwise is overclaiming on your behalf. State which providers you sampled. Seenby samples two at present, OpenAI and Perplexity, and the report should say so plainly rather than say "AI search" and let the room assume everything.
Building the report, in order
- Write the question the report answers, in one sentence
Something like: are we named when a buyer in our category asks an AI assistant for options, and who is named instead of us. A report without a stated question becomes a dashboard tour, and dashboard tours do not produce decisions.
- Freeze the prompt set before you measure anything
Fifty to a hundred prompts that represent how buyers actually ask, written once and then left alone. If the questions change between periods, the trend measures your editing, not the market. A frozen set is the single cheapest thing you can do for credibility.
- Name the competitors you are measured against
Pick up to three that the executive team already argues about. This is not optional housekeeping. A share of voice computed with nothing in the denominator returns a meaningless perfect score, and a perfect score is the fastest way to lose an executive audience permanently.
- Choose one headline metric and define it in a sentence
One number per brand per period, computed the same way every period. Share of AI Voice, the proportion of sampled answers where you are named relative to your named competitors, works because it survives being read aloud. Resist the second and third headline metric; they compete for the same attention and win nothing.
- Keep the model version behind every answer
Record which model produced each answer at the time it was read. When the number moves, this is the first thing you check, and the first thing you report. Drift caused by a model update is a real finding, just a different one from losing ground to a rival.
- Put the caveat in the artifact, not in the voiceover
The caveat belongs on the slide, in the email and next to the number, in readable type. Said aloud once, it disappears the moment the deck is forwarded. Written next to the score, it travels with it and protects every later reading of the same metric.
- Report a level and a direction, not a decimal
Say the score sits in the low twenties and has held for three weeks. Do not say 22.7 percent, up 0.4. A sampled measurement of a non-deterministic system does not support a decimal point, and quoting one invites arithmetic you cannot defend.
- Bring two or three verbatim answers
Paste the actual text of an answer where you were named and one where you were not. Executives argue with metrics and read quotes. The excerpt is also what turns the report into a working session, because someone will immediately notice what the answer got wrong about the product.
- End on one decision, with an owner
Not a list of recommendations. One thing you want agreed, such as rewriting a comparison page, or accepting that a rival owns a prompt cluster and choosing not to contest it this quarter. Reports that ask for nothing get read as reassurance and then get cut.
Overclaims and the defensible version of the same sentence
| Do not write this | Write this instead | Why the difference matters |
|---|---|---|
| We rank first in ChatGPT. | We were named in [count] of [set size] sampled prompts, and named first in [count] of them. | There is no single ranking inside an answer engine. There is a set of questions and a position within each answer, which is a different and more honest claim. |
| Our AI visibility is up 12 percent. | Share of AI Voice moved from the [band] range to the [band] range. Model versions changed inside the window, so part of the move is measurement. | Week over week shifts can reflect a provider model update rather than a competitive change. Saying so once protects every number that follows. |
| We hold 100 percent share of voice. | Against the three competitors we track, we were named in [count] of [count] comparable answers. | A share with no named rivals in the denominator is arithmetic, not a share. A perfect score is almost always a setup error, and a smart executive will spot it. |
| ChatGPT recommends us. | In [count] answers we were named alongside [competitor] and [competitor]. Two excerpts are below. | Recommendation is an interpretation of prose. Show the prose and let the room form the interpretation, which is also more persuasive. |
| We fixed our AI visibility. | We changed [asset] on [date]. The prompt set is unchanged, so next period's number is comparable. | Attribution here is weak. What you can defend is that you held the measurement steady while changing one input, and that is a real, modest claim. |
| AI search drives [x] percent of pipeline. | This data cannot attribute pipeline. It reports presence, sentiment and position on the providers we sample. | Presence data has no click path. Borrowing revenue language you cannot trace is how a young metric loses its budget line. |
The one slide, in six lines
The number and its direction
One headline metric for the period, with an arrow and a band rather than a decimal. If it has not moved outside the band you have seen before, say it is flat and move on.
The sample
How many prompts, which providers, which week. One line. This is the sentence that answers the phone-in-hand objection before it is raised, so it belongs above the fold, not in an appendix.
The caveat, in the same size type
That answers are non-deterministic, that provider models change without notice, and that a move may reflect a model update rather than the market. Same wording every period, so it stops being news and becomes method.
The competitor line
Your three named rivals with their standing beside yours, from the same answers. Be careful with bar charts here: a bar scaled to the leader makes a small share look large, which is an overclaim your chart made for you.
Two verbatim answers
One where you were named, one where you were absent, quoted as written and dated. This is the part of the report people remember and the part that produces the follow-up work.
One decision, one owner, one date
The editorial call belongs to the marketer, not to the metric. State what you propose, who does it, and when the next reading lands, then stop.
The three questions you will get back
"But the answers change every time I ask"
Agree immediately, then explain the design. A single ask is one draw from a distribution. You sample dozens of prompts on a fixed set on the same cadence, so the level is stable enough to compare even though any individual answer is not. Then give them the honest limit: this method detects large and sustained changes well, and small weekly movements badly. Anyone who promises precision here is selling you something.
"What is a good score?"
There is no published benchmark worth quoting, and inventing one is the worst thing you could do in this meeting. The useful frame is relative and internal: your level against your three named competitors, and your level against your own previous readings on the same prompt set. Say that plainly. "Good" is being named in the prompts where a buyer is choosing, and that is a prompt-level answer, not a score-level one.
"So what do we do about it?"
Answer from the prompt list, not from the headline. The prompts where you are never named tell you which questions the market does not associate with you. Some of those are worth contesting with content, product messaging or a comparison page. Some belong to a rival for structural reasons and are not worth the quarter. Bringing that judgement is the reason a person presents the report rather than emailing a dashboard link.
A cadence that separates noise from news
The reporting rhythm matters as much as the wording, because it decides how much variance reaches the executive.
Weekly, for you. Read the score, the sentiment split and the prompts that changed hands. Check the model versions before you interpret anything. Most weeks the answer is that nothing happened, and knowing that quickly is the point.
Monthly, for the executive. Four readings smooth most sampling noise, and a month is long enough for a content or messaging change to show up in answers if it is going to. This is where the six-line slide goes.
Quarterly, for strategy. Look at the prompt clusters rather than the headline. Which parts of the category name you consistently, which name a rival consistently, and what changed in the answers themselves. This is the reading that informs positioning, and it is worth writing as prose rather than a chart.
One warning about escalation. If you send an alert every time the number moves, the alerts get filtered. Reserve them for sustained movement and for cases where you can point at a model version change as the likely cause. Fewer, better-explained alerts keep the metric trusted.
Before the next board meeting
A short list to run through while the report is still editable.
- Is the prompt set identical to last period? If not, say so and do not draw a trend line across the change.
- Are competitors named, and are they the ones leadership argues about? A share against an empty set is not a share.
- Does every number on the slide carry its sample and its caveat in readable type?
- Have you checked model versions for the window, and can you say whether a move is likely drift from an update or a real shift?
- Is there a verbatim answer on the page, dated?
- Have you removed every decimal point the data does not support?
- Is there exactly one decision, with a name and a date against it?
- Have you said out loud what this data cannot tell you, before someone else does?
If you are producing this report for clients rather than for one employer, the constraint to plan around is different: Seenby tracks one brand per subscription, which shapes how an agency runs several accounts. The agency page in this pillar covers that arrangement. Otherwise the discipline is the same for everyone in this category right now. State the method, report the level, show the evidence, name the uncertainty, and leave the editorial call where it belongs.
Questions
What single metric should I put in front of executives?
One share metric per period, defined in a sentence and computed the same way every time. Share of AI Voice, the proportion of sampled answers naming you relative to your named competitors, works because it is comparable period to period and because it forces a competitor set into the definition. Add sentiment and position as supporting detail, not as second and third headlines.
How do I answer an executive who says AI answers change every time you ask?
Agree, then explain sampling. A single ask is one draw; a fixed set of fifty to a hundred prompts read on the same cadence gives a level that is stable enough to compare. Then state the limit honestly: the method detects large and sustained change well and small weekly movement badly, and week over week shifts can reflect a provider model update rather than a real competitive change.
How often should I report AI search performance upward?
Read it weekly yourself, report monthly to executives, and write a prompt-level review quarterly. Monthly smooths most sampling noise and is long enough for a content or messaging change to appear in answers. Reserve alerts between reports for sustained movement or for cases where a model version change explains the shift.
Can I report revenue or pipeline from AI search?
Not from presence data. Answer engines do not give you a click path from a sentence in an answer to a deal, so presence, sentiment and position are what this measurement supports. Keep revenue attribution in the demand-generation report and do not borrow its language here.
What is a good Share of AI Voice score?
There is no credible published benchmark to quote, so treat the number as relative. Compare yourself to your named competitors on the same answers and to your own previous readings on the same prompt set. The more useful judgement is prompt-level: whether you are named in the questions a buyer asks while choosing.
Why does a caveat need to sit next to the number rather than in a footnote?
Because the deck gets forwarded. A caveat delivered verbally reaches the people in the room once; a caveat written beside the score travels with it and governs how the number is read next quarter. Seenby stores its methodology caveat with every computed score and surfaces the disclosure on every score display for that reason.
Which AI providers should the report say it covers?
Name them explicitly rather than writing AI search and letting the reader assume full coverage. No tool reads every answer engine. Seenby samples OpenAI and Perplexity, and a report built on it should say so in the sample line.
What makes a report overclaim without the author noticing?
Three things, usually. A decimal point the sampling does not support, a share computed with no named competitors, which can return a meaningless perfect score, and a chart scaled to the leader so a small share renders as a nearly full bar. Each is an overclaim the artifact made on your behalf.
Related
- AI search reporting for SEO teams
Seenby is built to give an SEO lead one reportable number for AI search: a weekly Share of AI Voice score per brand, benchmarked against up to three named competitors, with the evidence and the caveat attached.
- AI visibility for ecommerce and consumer brands
Seenby is built to track how AI assistants name your ecommerce brand in shopping answers, scoring mentions, sentiment and rank position against up to three competitors you name.
- AI visibility tool for agencies: up to five client brands
Seenby is made for agency teams who have to report AI visibility per client.
- For brand managers: how does ChatGPT describe your brand
Seenby is built for brand managers who need a real answer to "how does ChatGPT describe us?", with weekly mention extraction, sentiment, rank position and one Share of AI Voice score per week.